Note
Go to the end to download the full example code
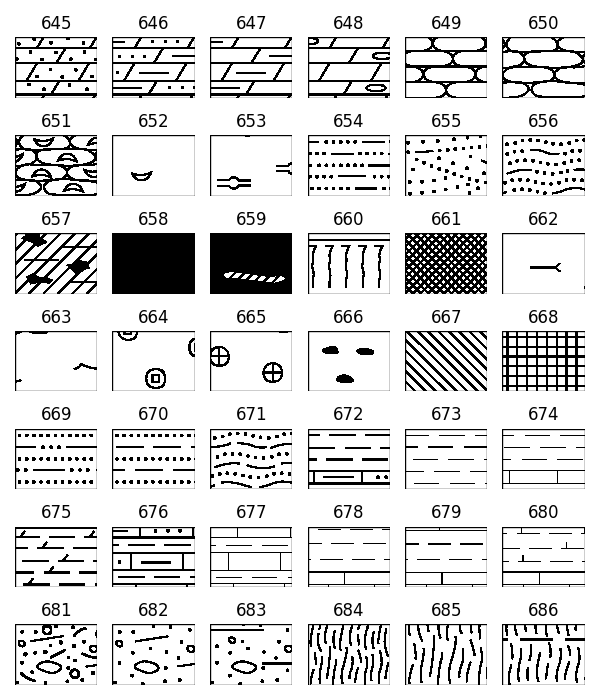
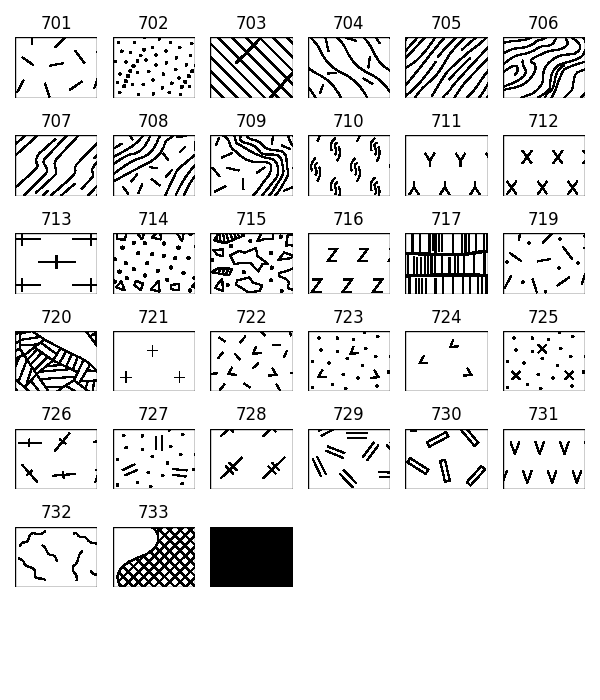
Demo USGS patterns

import itertools
import matplotlib.pyplot as plt
from matplotlib.patches import Rectangle
# import mpl_visual_context.patheffects as pe

from mpl_pe_pattern_usgs import PatternUSGS

pm = PatternUSGS()

kk = [k for k in sorted(pm.roots.keys()) if k > "600"]

while kk:
    fig = plt.figure(figsize=(6, 7))
    gs = fig.add_gridspec(7, 6)

    for gs1 in gs:
        ax = fig.add_subplot(gs1)
        ax.axis("off")

        patch = Rectangle((0, 0), 1, 1,
                          fc="k", ec="k", transform=ax.transAxes,
                          )
        ax.add_patch(patch)

        if kk:
            k = kk.pop(0)
            pattern = pm.get(k, scale=4)
            patch.set_path_effects([# pe.FillOnly(),
                pattern.fill(ax),
            ])

            ax.set_title(k)
        else:
            break

    fig.tight_layout()

plt.show()
Total running time of the script: (0 minutes 4.219 seconds)